Image from U.S. Department of Agriculture
Nutrition in Infancy, Childhood and Youth
A Chapter in Core Concepts of Pediatrics, 2nd Edition
Patricia S. Beach MD and Krystal Revai MD, MPH
|
Image from U.S. Department of Agriculture |
This module is intended for pediatric health professionals, pediatric residents, medical students in pediatrics, and others with a healthy curiosity about the principles of good nutrition during the growing years.
On completion of this module, the user should have a better understanding of the pediatrician's role in promoting good nutrition and healthy lifestyle.
These objectives should be met:
Good nutrition can be provided through a diet which includes all the substances necessary to sustain life and support growth without producing harm from excessive amounts of those substances. Variations in sources of nutrition will be better tolerated by some individuals than others. For example, a familial predisposition to hyperlipidemia and cardiovascular disease makes it imperative that some individuals limit intake of fats.
How much of certain nutrients does a person need to be healthy?
The standing Committee on the Scientific Evaluation of Dietary Reference Intakes of the Food and Nutrition Board, Institute of Medicine of the National Academies of Sciences has attempted to develop reference data regarding the amount of various nutrients needed by an apparently healthy general population. These recommendations are based on the following:
The Committee releases four Dietary Reference Intakes (DRI):
It is important to note that:
|
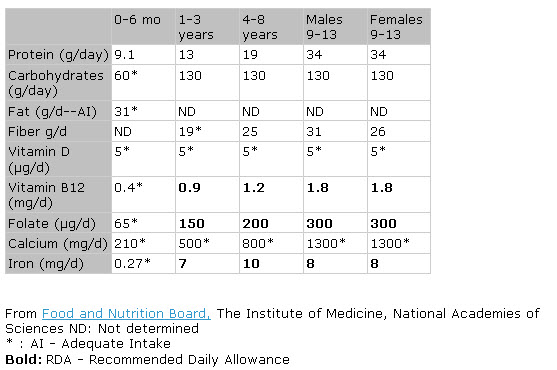
More on the Dietary Reference Intakes (DRI) for various nutrients vary by age, as is illustrated by the table below here. |
|
DRI's by Age
|
You are examining 18-month old Jonathan. There is no growth chart available in his chart, the clinic has just run out of pre-printed copies, and the EMR is down for the afternoon. Where can you go for more growth charts?
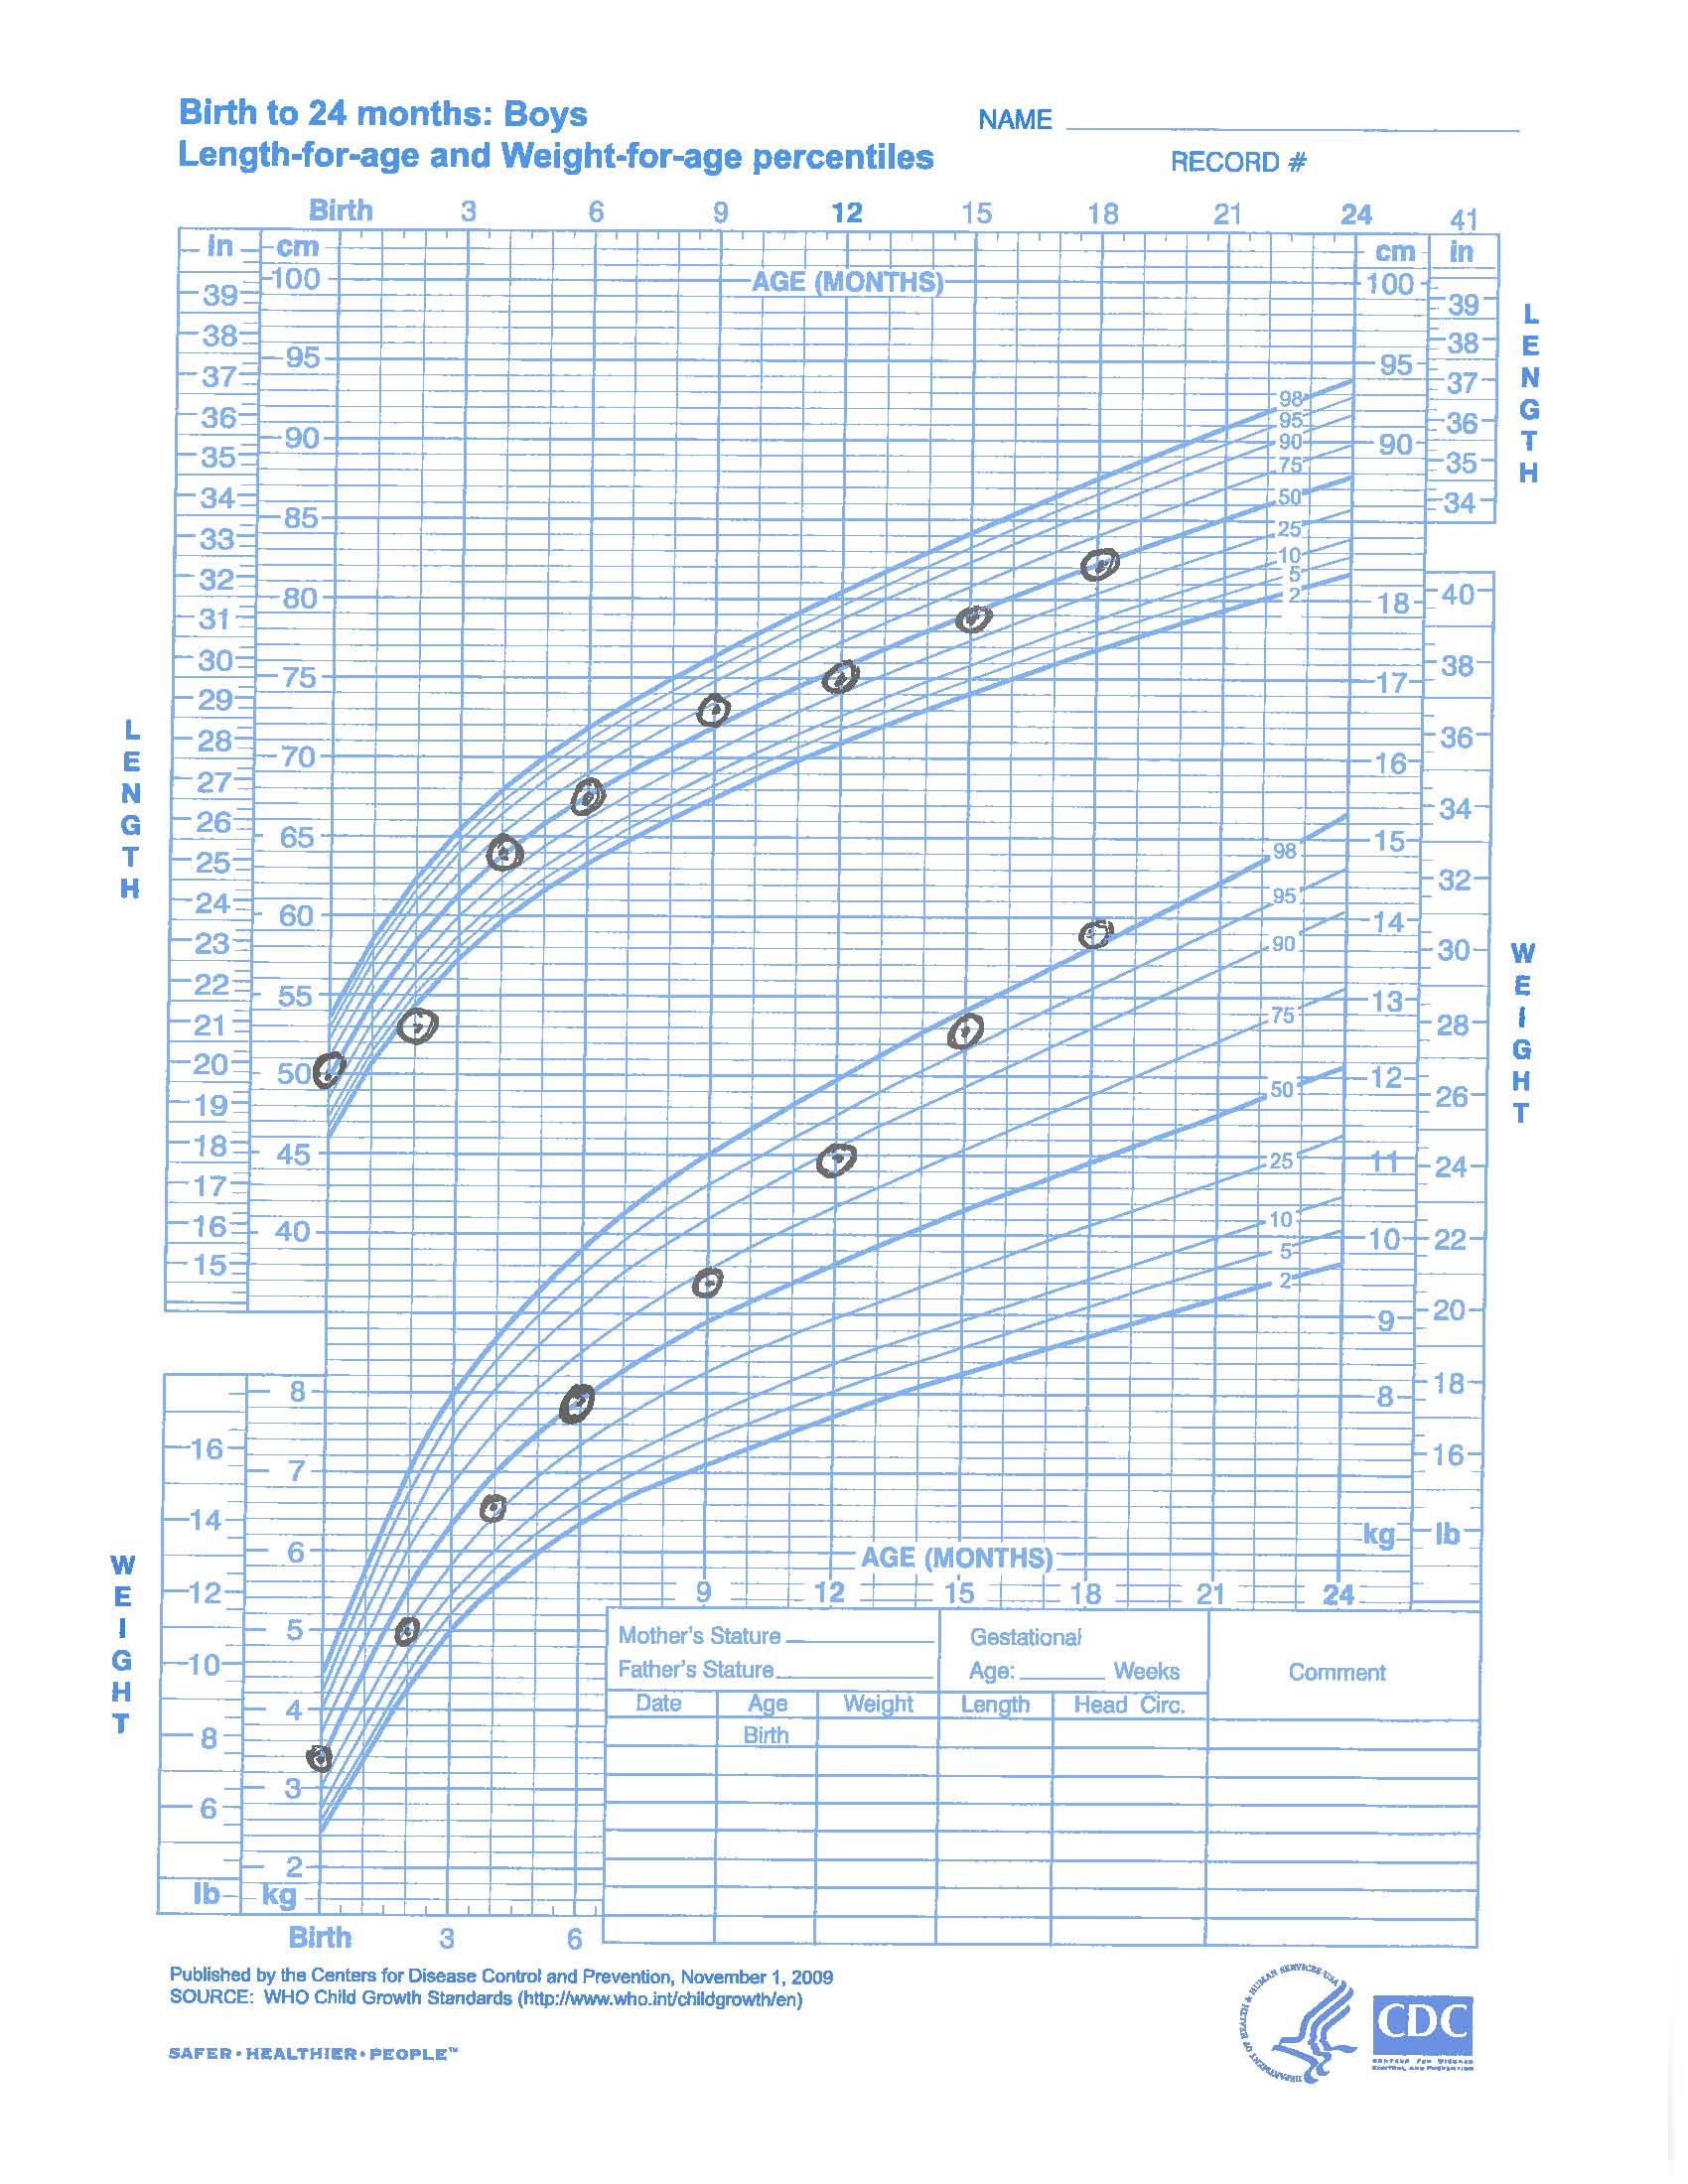
Growth charts can easily be found through the Center for Disease Control at http://www.cdc.gov/growthcharts/. Note that growth charts from the World Health Organizations (WHO) are the preferred chart for children 0-3 years, and CDC charts for older children
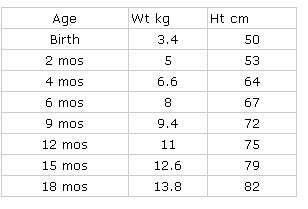
Jonathan's mother has all his previous records, so you can extract all the data points from previous visits.
|
The data you extracted are as follows: |
The data are plotted below. Note the change in weight relative to length. |
|---|---|
|
|
|
|
Clinical Challenge |
|
|
Caloric needs vary depending on age, just as do nutrient needs. Healthy full-term newborns require, on average, 120 kcal/kg/day to meet their energy needs and sustain growth. On a per kilogram basis, caloric needs decrease with age. The average 1-3 year old child requires only 100 kcal/kg/day. Once growth has ceased caloric requirements are impacted by age, activity and other health factors, but can be approximated as 1500 kcal/M2/day.
|
Calculate your personal caloric requirement.
|
Individual health issues also impact caloric needs. For example, children with heart disease have increased caloric needs because of increased work required to circulate blood with an inefficient pump; sedentary children require fewer calories than very active children; and burned children have extremely large increases in caloric needs during the healing process.
Calories, once absorbed, are used in four ways:
Growth utilizes a huge proportion of the calories ingested by children. When growth ceases, the caloric intake must decrease in order to maintain weight. If caloric intake exceeds requirements, the extra intake will remain in body stores.
The proportion of calories used for activity varies, thus sedentary children are at risk for obesity.
Several terms must be explained in order to understand the use of calories to support life functions (e.g. circulation, respiration).
REE and BMR usually differ by less than 10%, but REE is higher because it includes energy expenditures for mental activity and other energy expenditures. Both are measured as kilocalories (kcals) or units of heat. Both will be affected by age, body size and composition, disease states such as febrile illnesses, malabsorption, trauma or infection.
Healthy newborns require about 55 kcal/ kg/day to satisfy needs for basal metabolism; mature humans require only 25-30 kcal/kg/day.
Healthy infants use about 7-10% of ingested calories to support the thermal effect of food; older children apply on the average about 5% of ingested calories toward this purpose.
Energy expenditure is most commonly determined by indirect calorimetry, measuring oxygen consumption and carbon dioxide production, and is expressed as a respiratory quotient (RQ) (ratio of CO2 production to O2 consumption). RQ varies based on the dietary substrate.
RQ for fat is 0.7
RQ for protein is 0.85
RQ for carbohydrates is 1.0

The Institute of Medicine has published equations for estimating energy requirements. Such predictions do NOT take in to account energy expenditures in the presence of disease. Fever, malabsorption (e.g. cystic fibrosis) and heart disease, among many other conditions, will all increase energy requirements above these estimates. These calculations are complex and depend upon age, weight, height (over age 3 years) a "physical activity coefficient" assigned to children over age 3 years, based upon their activity. Thus children who "wiggle" even when quiet will have higher energy expenditures than those who sit quietly at a desk.
Estimated Energy Requirements
Human milk is the preferred source of nutrition for infants, according to the World Health Organization (WHO), AAP and Canadian Pediatric Society (CPS). Ideally human milk is the sole source of nutrition for the first six months of life. The AAP recommends mother's provide breastmilk for their infants up to one year of age. The World Health Organization (WHO) recommends breastfeeding until two years of age. There is no age at which breastfeeding must be stopped. This should solely be the choice of the child and mother. Despite a constant attempt by companies which develop and market human milk substitutes (formula) to develop preparations which are increasingly similar to human milk no static preparation can compare to human milk which is constantly changing in response to the baby and mother's environment.
|
Image by Kyrylo Ryzhov from Photospin |
In the United States, 60-70% of mothers initiate breastfeeding, with over 40% continuing until at least 6 months. Breastfeeding is associated with increased maternal education, increased parity, married status and increased maternal age. Return to work by 6 months of age is associated with weaning by 6 months of age.1 Breastfeeding is less common among Hispanic and African-American women than among White women. (From AAP Pediatric Nutrition Handbook)
Unique adaptations
Only human milk is uniquely adapted to the needs of human infants, and indeed to the individual human infant. For example, for a baby born prematurely, the mother's milk has a higher nitrogen content than milk produced by a mother of a term infant. The content of human milk varies from day to day and even from the beginning to the end of a feeding in a manner adapted to the needs of the individual infant. If a mother and her infant are exposed to a pathogen, such as an enterovirus causing diarrhea, oligosaccharides found in the mother's milk coat the gastroesophageal mucosa. Pathogens bind to the oligosaccharides which are then excreted in stool.
Ease of digestion
One major advantages of human milk is the relative ease of digestion. Human milk contains 70% whey proteins and 30% casein proteins, a ratio nearly opposite that of bovine (cow's) milk. The whey protein is generally more easily digested and promotes gastric emptying. The major whey protein is alpha-lactalbumin.
Increased immunological protection
Another major advantage of human milk is increased immunological protection. Studies of breast fed infants consistently show decreased rates of otitis media, gastroenteritis and a variety of other infections; and the effect is dose-dependent. Lactoferrin, lysozyme and secretory IgA are whey proteins involved in host defense which are not available to infants who are formula-fed. It is estimated that optimal breastfeeding world-wide would save an estimated 1 million lives each year from death by infection.
Other advantages
1. BMC Pregnancy Childbirth. 2016 Jul 29;16(1):194. doi: 10.1186/s12884-016-0965-1.Determinants of breastfeeding initiation and cessation among employed mothers: a prospective cohort study.Dagher RK 1 , McGovern PM 2 , Schold JD 3 , Randall XJ 4 .
What is the estimated cost for feeding a newborn various preparations for one year?
Hint: on average, human milk or formula intake can be estimated at 24-32 ounces per day.
|
Annual Costs of Breastfeeding vs. Formula |
||||||||||||||||||||||||||||||||||||||||
*DHA is docosahexaenoic acid. ARA is arachidonic acid - long-chain fatty acids found in human milk but not bovine milk, commonly referred to as lipil |
Go to the next page for the complete Annual Cost of breastfeeding vs. formula
|
Annual Costs of Breastfeeding vs. Formula |
||||||||||||||||||||||||||||||
|
It should be obvious that the cost for formula is substantial. Imagine what families could do with an extra $1000-2000!
Additional economic benefits are estimated to be as much as $331 during the first year from decreased visits to a medical provider and decreased hospitalizations for illnesses which might be prevented by breastfeeding.
Recall that healthy newborn infants need approximately 120 kcal/kg/day to gain weight at the desired rate of 15-30 gm per day. Both infant formula and breastmilk have the same average calories per ounce: 20 kcal/ounce.
(Note: 30 ml=1 ounce.)
![]()
The practice of giving formula after nursing at the breast is called "topping off." Topping off sets the mother and baby up for decreased milk supply and premature weaning.
Topping off sets up the vicious cycle demonstrated by the following diagram:

Use the table below to determine what the "cost" for the WIC "free" formula (i.e. extra formula, diapers, and lost work days)?
Assume this family of two makes $655/week or $2620/month.
| amount | Unit Cost | Total Cost/Month | |
|---|---|---|---|
| Extra Formula | 240 oz | $.08/oz | ? |
| Extra Diapers | 80 | $.22 each | ? |
| Lost work days | 2 | $131/day | ? |
| Total | ? |
![]()
WIC "Cost" of "Free" Formula
What is the Percent of monthly salary of the "cost" of the WIC "free" formula (i.e. extra formula and diapers and lost work days)?
| amount | Unit Cost | Total Cost/Month | Percent of monthly salary | |
|---|---|---|---|---|
| Extra Formula | 240 oz | $.08/oz | $19.20 | ? |
| Extra Diapers | 80 | $.22 each | $17.60 | .? |
| Lost work days | 2 | $131/day | $262.00 | ? |
| Total | $298.8 | ? |

For more information on Texas WIC food packages and a comparison of breastfeeding food packages versus non breastfeeding food packages link here
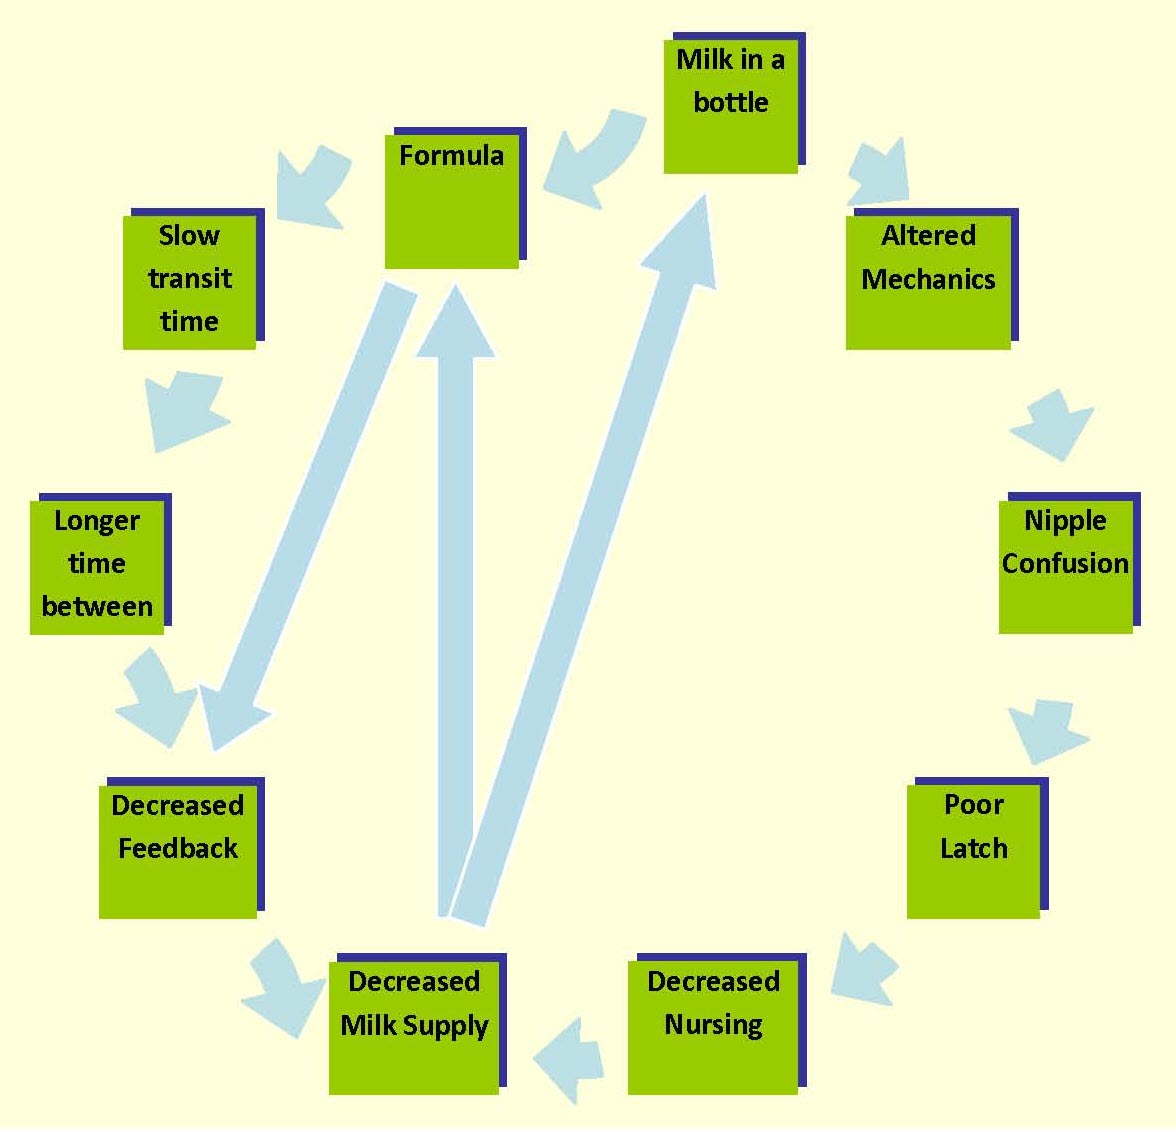
Image based on Krystal Revai's original

Iron deficiency is the most common nutritional deficiency in the United States. Iron is important for at least three reasons:
Not all deficits from iron deficiency or lead toxicity are reversible with treatment.
For the first 12 months of life, babies need either the iron in breastmilk, or iron-fortified formula. Why?
Cow's milk contains only a negligible amount of iron, and it is poorly absorbed. Iron-fortified formula is recommended.
Although breast milk also contains only small amounts of iron, 50% of that iron is absorbed by the baby, better iron absorption than from any other food.
Iron is poorly absorbed from many common dietary sources such as iron-fortified infant cereals.
Intake of solid food decreases the bioavailability of iron in breastmilk. Therefore, even breastfed infants should receive iron from supplementation when they begin to eat solid foods. For families who will feed their infants meat proteins, these should be introduced early.
Cow's milk can cause colitis in some children with subclinical loss of blood in the stool, further exacerbating iron deficiency.
Because of high rates of iron deficiency in the US, in the 1970's, the federal Women, Infants and Children (WIC) program was developed for low income families. The mission of WIC is this:
To safeguard the health of low-income women, infants, and children up to age 5 who are at nutritional risk, by providing nutritious foods to supplement diets, information on healthy eating, and referrals to health care.
WIC is authorized to supply only iron-containing formulas.
WIC supplies dietary food vouchers for lactating mothers, and in many centers, also electric breast pumps.
Adequate calcium intake is important for developing bones. Failure to achieve adequate intake of calcium results in decreased bone mineral density and may predispose children to develop osteoporosis later in life.
Recommended intake depends on the age of the child.
The major source of calcium is milk and other dairy products, some green vegetables (e.g.. broccoli ) and soy products. The widespread consumption of soft drinks and juices, instead of milk, is contributing to calcium deficiencies. How can children and teenagers get enough of these dietary components?
How easy is it to get the recommended amount of calcium?
You have correctly advised a parent that her 5 year-old needs about 800 mg calcium per day. How much of food is needed to reach this recommended amount?
![]()
During normal term pregnancy, the assimilation of calcium and phosphorous occurs at a high rate during the last trimester. After birth, calcium absorbed from human milk provides only a fraction of the calcium that would have been supplied to the infant were he/she still in utero. Therefore, premature infants are at special risk for bone disease due to inadequate intake and assimilation of calcium. Infants under 1000 grams at birth or 28 week's gestation are at particular risk for osteopenia of prematurity, or bone mineral content significantly below that of expected mineralization for a fetus or infant of comparable size and gestational age. Several commercial mineral supplements for human milk-fed infants are available to human infants to optimize bone mineralization in this vulnerable population.
Routine vitamin supplementation is not recommended for school-aged children. Children should obtain necessary nutrients from an adequate, well-balanced diet. Such a diet should provide Recommended Dietary Allowances (RDA's) for all vitamins, minerals and micronutrients, including those for which no RDA has been established.1
However, there are several special populations for which the American Academy of Pediatrics (AAP) does recommend vitamin supplementation.
Infants: Although human milk contains small amounts of vitamin D, many nutritionists believe this is not enough to prevent rickets. Therefore, the AAP recommends that breastfed infants receive 400 IU of oral vitamin D daily or, until 500 ml of vitamin D-fortified formula or milk is added to their diet.
Nutritionally at-risk children and teens: Children with chronic illnesses such as celiac disease, cystic fibrosis or bronchopulmonary dysplasia, are at-risk for nutritional deficiencies. These children may benefit from multivitamin supplementation including specifically, iron, calcium and Vitamin B complex. Routine vitamin supplementation is not recommended for adolescents, but is suggested for nutritionally at-risk teenagers. This is especially important for teenage female athletes. The "female athlete triad" refers to the combination of disordered eating, amenorrhea, and osteoporosis.
[BPS1]Delete hyphen
The Dietary Reference Intakes (DRIs) provide estimated average requirements of vitamins for various age groups.
|
For More Information: |
|
Effects of common Vitamin Deficiencies Effects of Excess Vitamins |
In addition the CDC offers a Dietary Reference Index Calculator for many different nutrients which can be accessed here: http://fnic.nal.usda.gov/dietary-guidance/dietary-reference-intakes
While useful for discussion, there are often elements of both inadequate calories and environmental stresses present when infants and children are not gaining enough weight.
 Approximately 7% of Americans choose a vegetarian diet, 1% choose a lacto-ovo vegetarian diet (no meat, fish or poultry flesh), and 0.1% follow a vegan diet (no animal foods) . These choices are based on cultural or religious traditions, perceived health benefits, or for philosophical reasons. Most vegetarian, lacto-ovo and vegan diets can meet the needs of growing children with appropriate planning or, in some cases, supplementation.
Are there risks from a vegetarian diet?
Without careful planning, a vegetarian diet might be deficient in Vitamin B12, protein, iron, and/or vitamin D. Healthcare providers should be aware of the rich sources for these nutrients so they can determine, through dietary history, which nutrients may be deficient in the child's diet and can counsel on ways to either alter dietary intake or supplement. In many cases, a single session with a dietician can be very helpful.
|
Nutrient |
Good Source |
Comments |
|
Calories |
Oils, nuts (beware of choking risk for small children!), nut butters and fruit juices. |
Energy intake in very restricted diets may be insufficient for infants just weaned from bottle or breast and small children. |
|
|
Combining legumes with rice or corn generally delivers all the essential amino acids in one meal. Mixtures of high protein sources is advisable (mixture of legumes, cereal, nuts seeds, fruits and other vegetables). Soy is a good source of protein, especially if supplemented with methionine, as it is in soy-based formulas. |
Vegetarian sources are usually sufficient in protein for growing children. Dietary consultation may be appropriate for helping a parent understand which combinations deliver a balanced supply of essential amino acids. |
|
Fats |
Consult a dietician. |
For children over 2 years, if dietary fat is below 15% of calories, special care must be taken to provide that essential fatty acid requirements are met. |
|
Vitamin B12 (Cobalamine) |
B12 is found in meat products. Levels are high in colostrum compared to human milk at 3 months post partum. B12 is found in breast milk in proportion to the amount of maternal ingested B12. |
B12 deficiency may result in megaloblastic anemia and neurologic abnormalities. Special attention should be paid to B12 consumption in vegan diets
|
|
Iron |
High in meats; some commercially available cereals are iron-fortified. |
Iron absorption is improved in presence of iron deficiency; impaired in presence of tannins (tea) and phytins (in foods high in fiber). Iron content in foods does not reflect bioavailability (e.g., 50% of iron available in human milk is absorbed, but only 4% of iron in fortified formula is absorbed.) |
|
Vitamin D |
Added to milk. Sunlight is excellent source for manufacture of Vitamin D in skin, liver and kidney. |
Infants are at risk for deficiency if swaddled and living in climates with reduced sunlight. |
Failure to Thrive (FTT) is defined as 'growth deceleration' in a young child. The term usually implies one the following patterns:
Failure to thrive is a symptom of an underlying process; and the goal of evaluation is to determine that underlying cause. Failing to grow reflects one of four problems:
Failure to thrive has traditionally been divided into two broad categories: organic and non-organic. While useful for discussion, there are often elements of both inadequate calories and environmental stresses when infants and children are not gaining enough weight.
Non-organic Failure to Thrive is the failure of a child under age 5 years to gain weight due to environmental challenges. The term is reserved for cases for which an organic cause cannot be identified and implies that there are psychological or environmental etiologic factors present. Non-organic failure-to-thrive is diagnosed based upon the demonstrated ability of a child to gain weight properly when given adequate nutrition. However, it is not unusual for a child with non-organic FTT to have associated medical or developmental issues which present challenges to a otherwise emotionally or financially stressed caretaker.
Newborn infants should regain their birth weight by two weeks of age; any child who has not may be categorized as failing to thrive.
Newborns may fail to regain their birth weight if there is inadequate caloric intake from inefficient breastfeeding or from improper preparation (i.e. dilution) or inadequate intake of formula. Inadequate caloric intake may also be secondary to a) severe gastroesophageal reflux disease or b) central nervous system disease leading to poor muscle tone and subsequent poor feeding (e.g. as seen in Down Syndrome)
Severe milk protein allergy or cystic fibrosis may contribute to malabsorption. Infection results in inadequate calories for growth, as the calories instead go to fighting infection. Congenital heart disease (inefficient heart) results in excessive caloric requirement.
Around 6-9 months of age, there is a natural growth deceleration. This correlates with the introduction of solid food and gradual decrease in the total amount of formula or breast milk ingestion. Deceleration is most noticeable when weight percentiles have previously exceeded height percentiles. These children may be following normal growth variance and not failing to thrive.
This deceleration may be more pronounced in three groups:
Children who have poor weight gain secondary to inadequate nutrition intake will typically begin to cross percentiles in weight before height. Malnutrition tends to "spare the brain" as much as possible so that large decrements in percentile for head circumference are unusual and found only in cases of prolonged or severe malnutrition.
Beyond the newborn period, into infancy, several other disease processes may manifest as failure to thrive.
After one year of age, solid foods constitute the majority of the child's diet, and formula should be replaced by whole milk. Toddlers may continue to breastfeed beyond one year of age, but solid foods should comprise the majority of their diet. Many children will have a natural decrease in appetite because of slower growth after the first year. If parents are unaware of this expected decrease in appetite, they may respond by offering frequent snacks or large quantities of juice which is generally high in sugar but low in nutritional value. The sugar may fill the child (i.e. not hungry for other foods), which then contributes to inadequate total caloric intake.
|
More Information |
|
Additional information about juice intake is available from the American Academy of Pediatrics policy statement on Lipid Screening and Cardiovascular Health in Childhood. Table 5-1, or from the policy statement of the AAP on juice intake http://pediatrics.aappublications.org/content/107/5/1210.
|
Underlying chronic inflammatory, malignant or metabolic conditions may still be contributors to failure to thrive at this age as well as the previously mentioned causes of malabsorption and
Psychosocial issues must be considered during a work-up for failure to thrive. If no organic cause can be found, failure to thrive may be rooted in poverty, family dysfunction, poor parenting skills which contribute to inadequate caloric intake, and/or complex interactions involving stress responses even in the presence of adequate calories. In some situations, the child may fail to thrive until removed from the non-nurturing environment. In many cases the etiology is complex (i.e. organic and non-organic) and solutions are not simple.
Economic stress may tempt a parent to dilute formula to make it last as longer. Thankfully, with the advent of nutritional support programs in the United States (e.g. WIC), this is less of a problem than it once was. However, whenever evaluating a child for failure to thrive, a complete history should include formula preparation technique and a thorough dietary history.
Failure-to-thrive should be differentiated from the following conditions:
The evaluation of a child with failure-to-thrive requires several critical steps:
Hospitalization is usually not required except in children who show evidence of chronic or severe malnutrition, children who continue to show poor weight gain despite aggressive outpatient evaluation and therapy, and children who may be in an environment that suggests maltreatment or danger to the child.

You are seeing 15-month old Becka Pequena for her well child exam. Becka's growth curve is shown here.
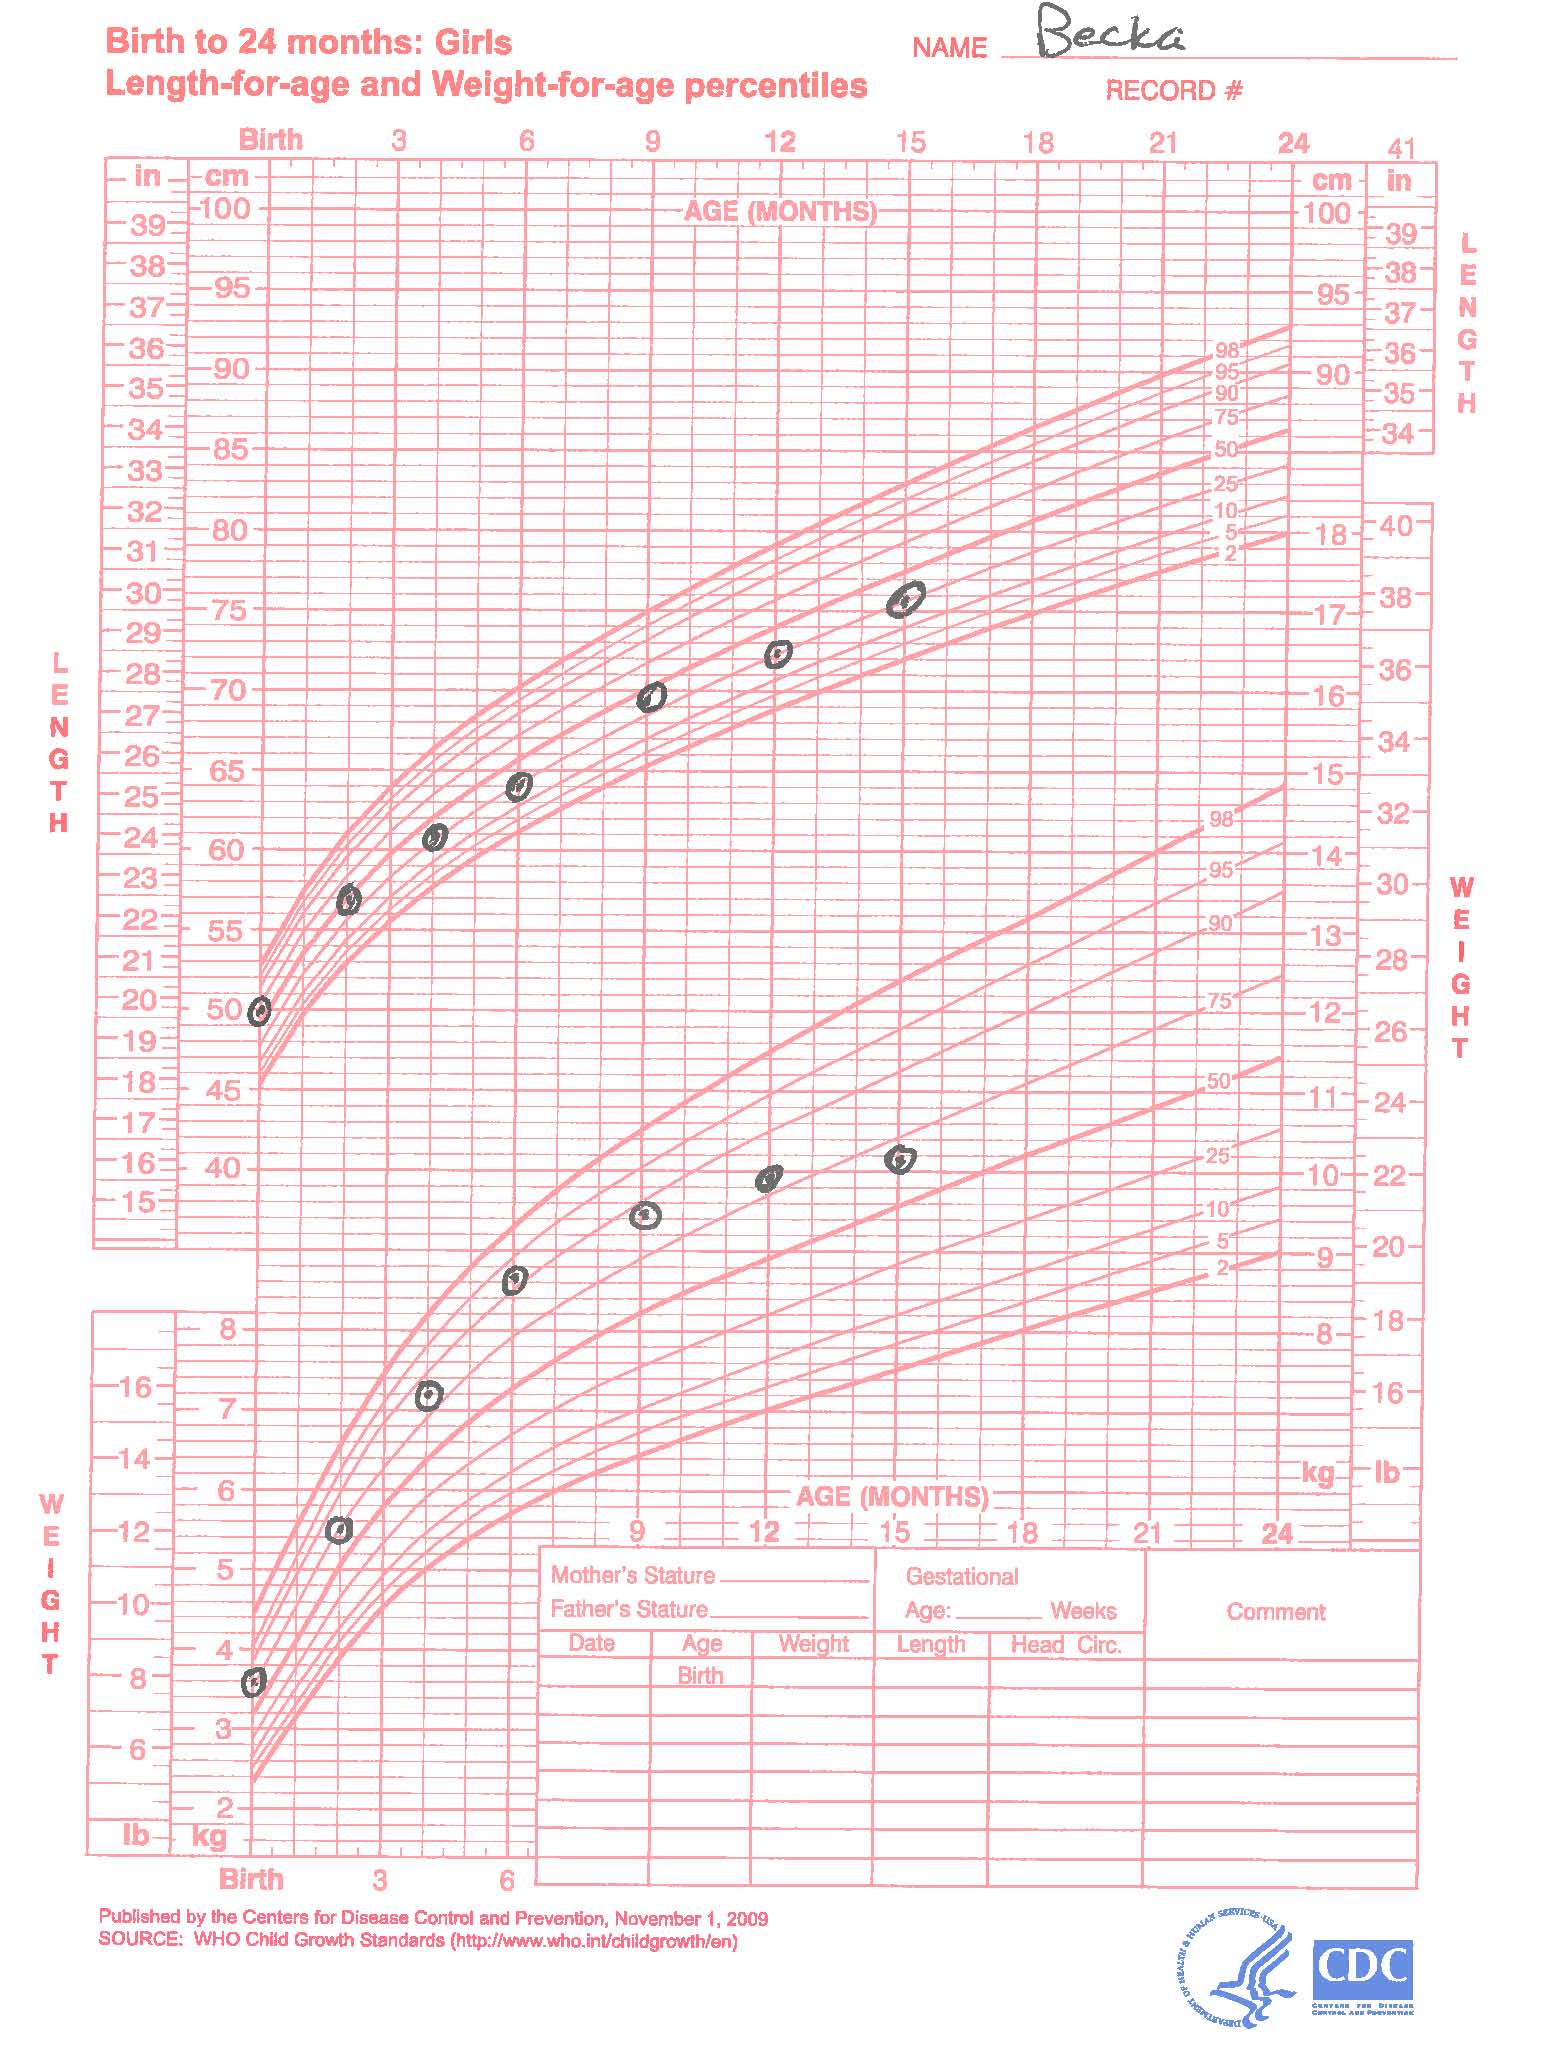
On history you find that this baby was a healthy term baby in the 75% for weight, length, and head circumference at birth. She has not had any major illnesses in her life and has not had to be hospitalized. Her appetite is "OK" according to Mrs. Pequena. Becka weaned herself from the breast at about 10 months of age. She never really took to infant formula, so Mrs. Pequena started whole milk. The whole milk made Becka very constipated, so her mother started to give her some juice to help with the constipation. At presentation, Becka drinks about 24 oz of whole milk and 24 oz of juice a day and does not take vitamins or other medications.
A typical day consists of 1/4 cup of Cheerios with an 8 oz bottle of milk. Becka may snack on some of mom's eggs in the morning. She usually has a snack of fruit or 4-8 oz juice with some peanut butter or graham crackers before her morning nap. For lunch Becka may have a half a cheese sandwich or a jar of stage 3 baby food and 4 oz of milk. She generally drinks an 8 oz. bottle of apple juice at intervals during the afternoon, and may snack on some crackers or banana slices. For dinner, Mrs. Pequena gives her cut up table food (generally 1/2 cup meat and potatoes or rice) with another 8 oz. of milk. She has a bottle of juice or milk before bed time. Mrs. Pequena does not want to force her to eat but, she is concerned that she is not eating enough.
Becka lives with both parents and 4 year old brother. Becka's mother is 5'4 and her father is 5'7. Mrs. Pequena is unsure of the age of her home, but she describes it as "older." The house did have some pealing paint and was recently re-painted. Mrs. Pequena reports no severe stresses in the home. She does not believe her children have been abused by anyone-they are almost always with her!
The growth pattern shown is not unusual for breast fed children. The WHO has developed standard growth curves for breast fed children, which can be found here:http://www.cdc.gov/growthcharts/index.htm.
With this history of high milk intake and low food intake, Becka is at risk for iron-deficiency anemia, which may further depress her appetite. A CBC is warranted. Although the house that Becka lives in was recently painted, the old paint was peeling and it is an "older" home. Therefore, a lead level should be done. In fact, checking for anemia and lead poisoning is standard screening for 12 month well child checks. Becka's parents are both around the 25th percentile for height - a context which would imply that Becka's height is normal for her.
Becka should be followed in the next several months to see if the suggested changes to Becka's diet helped. Careful attention should be paid to psychosocial and environmental parameters, but at this point a referral to CPS is not warranted.
Obesity has been increasing in the United States over the last several decades. Data from the National Health and Nutrition Examination Survey (NHANES, 2010) indicate that 17% of children ages 2-19 are overweight, with trends showing a steady increase from a prevalence of 4% in 1963.
Additional information about childhood obesity in the United States can be found at the Centers for Disease Control and Prevention wesbite at www.cdc.gov/obesity/childhood/index.html
Why is obesity increasing?
Causes of increased rates of obesity are many and varied, and include the following:
In Texas, 36.7% of children under age 18 are at-risk for overweight (BMI>85 percentile for age) and an additional 22.1% of children are overweight (> 95% BMI for age) (10).
Overweight status is associated with numerous significant health problems, including:
Assessment of "risk for overweight" and "overweight" are based on Body Mass Index (BMI), the ratio of weight/height2. BMI is most easily calculated as
kg ÷ (cm)2 X 10,000 or pounds ÷ (inches)2 X 703
Any child with a BMI above 85th percentile is overweight, and any child above the 95th percentile is obese. Obesity is associated with increased risk of several complications, including insulin resistance, hypertension, dyslipidemias, obstructive sleep apnea, orthopedic problems, pseudotumor cerebri, obesity hypoventilation syndrome, and fatty changes in the liver.
| Age/Gender | Weight/ percentile | Height/percentile | BMI/category (normal, at-risk, or overwieght) |
|---|---|---|---|
| 12 year-old/ female | 42 kg/ 50% | 151 cm/ 50% | |
| 12 year-old/ female | 52 kg/ 75-90% | 151 cm/ 50% | |
| 16 year-old/ female | 78 kg/ 95% | 160 cm/ 25-50% | |
| 16 year-old/ female | 68kg/ 75% | 160 cm/ 25-50% | |
| 16 year-old/ female | 63kg/ 75-90% | 160 cm/ 25-50% | |
| 4 year-old/ male | 16kg/ 50% | 102 cm/ 25-50% | |
| 4 year-old/ male | 18kg/ 75% | 102 cm/ 50% | |
| 4 year-old/ male | 20kg/ 95% | 102 cm/ 50% | |
| 12 year-old/ male | 42kg/ 50% | 155 cm/ 75% | |
| 12 year-old/m ale | 62kg/ >95% | 155 cm/ 75% |
BMI Exercise: (ANSWERS)
Strategies to prevent overweight and interventions to treat overweight are not simple. The following strategies are important:
It is important that health professionals working with families give positive feedback even for small successes, such as a slight drop in BMI even if weight has increased, or the family cutting television from four hours to two per day.
Additional reasonable recommendations include
How do we decide which children truly need our attention?
Management of obesity is dependent on whether or not the child is having complications from their obesity. The algorithm recommended by Barlow and Dietz (3) suggests the following management
|
Children ages 2-7 years |
BMI 85-94 %tile |
Weight maintenance |
|
Children ages 2-7 years |
BMI > 95 %tile without complications |
Weight maintenance |
|
Children ages 2-7 years |
BMI > 95 %tile with complications |
Weight loss |
|
Children > 7 years |
BMI 85-94 %tile without complications |
Weight maintenance |
|
Children > 7 years |
BMI 85-94 %tile with complications |
Weight loss |
|
Children > 7 years |
BMI > 95 %tile |
Weight loss |
Complications include mild hypertension, dyslipidemias, and insulin resistance. Acute complications include pseudotumor cerebri, sleep apnea, obesity hypoventilation syndrome or orthopedic problems should be referred to a pediatric obesity center if possible, and should be managed aggressively.
Interventions to prevent and treat an overweight condition are not simple. Usually involvement of the whole family is required. It is important to help families assess their own readiness for change and to identify saboteurs, such as indulgent grandparents. Healthy eating may involve change for all members of the family, including those whose weight is normal. And finally, it is important that health professionals working with families give positive feedback for small successes-a slight drop in BMI even if weight has increased, or cutting television from 4 hours to 2 per day.
At this site are many tools to assist healthcare professionals and their patients and families in making small but significant changes:http://www.choosemyplate.gov. Especially note "10 Tips Nutritional Education Series" which allows patients to choose one thing they could change and provides strategies for success.
It has been said that "You are what you eat." Given that nutrition is crucial for growth and development, this is certainly true in pediatrics.
Good nutrition for children has both short- and long-term implications for health. It is crucial that health care providers assess nutritional status repeatedly during childhood and guide parents and patients toward a lifelong habit of healthy eating.
Here's to your health and the health of your patients!