EKG Interpretation
S. Bhatia, MD, L. Yun, S. Munir, M.E. Gomez, MD A. Aly, MD, PhD
Before you read the EKG, look for:
- Patient age: as many values change with age
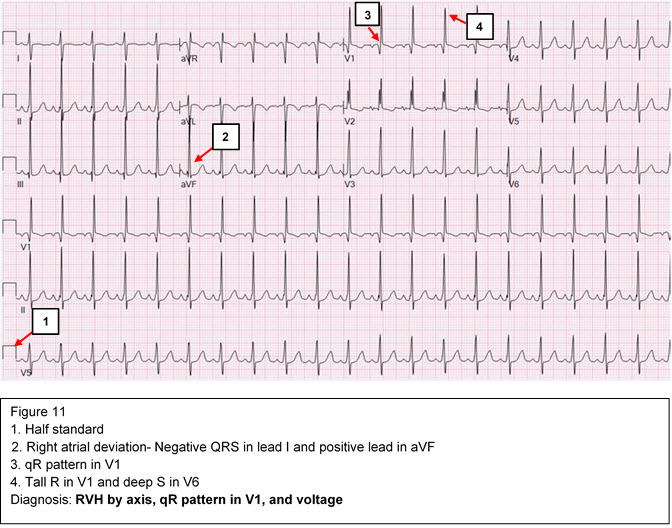
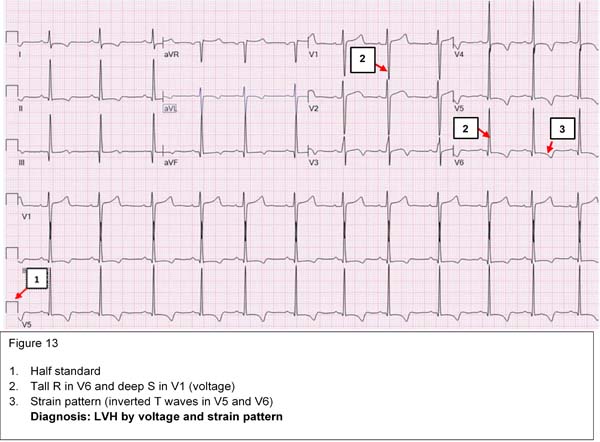
- Standardization: full standard is two large squares (1 mV, 10 mm) and half standard is one large square (0.5mV, 5 mm)
- Paper speed: the standard is 25 mm/sec, the faster the paper speed the slower the HR will look and vice versa
Basic EKG interpretation
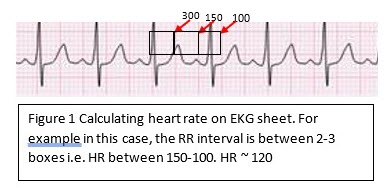
1. Heart rate: The standard paper speed is 25 mm (5 large squares)/sec. This means that if the interval between two beats (R-R) is 5 large squares, the HR is 60 beat/min.
- The HR may be counted by simply dividing 300 by the number of the large squares between two heart beats (R-R).
- If the interval between two beats is one large square, the HR is 300 beat/min, 2 squares →150, 3 squares →100, 4 squares → 75, 5 squares → 60, 6 squares → 50 beat/min.
2. Rhythm: The cardiac myocytes have an inherent automaticity and can generate an electric impulse. The SA nodal cells have the fastest automaticity (pacemaker) and hence control the heart rate and rhythm. There are 4 levels of conductions and potential pacemakers in the heart from fastest to slowest: SA node → atria → AV node → ventricles. If the rhythm is not sinus, we have to determine the origin of the pacemaker and where the impulse is initiated.
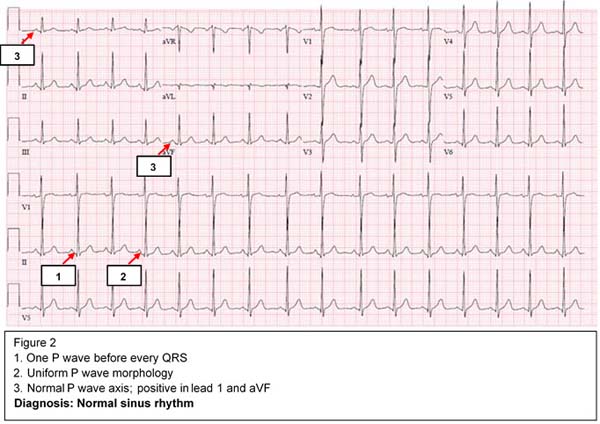
- SA nodal rhythm (normal sinus rhythm) (NSR) (Figure 2)
- The sinus node is located at the SVC/right atrial junction. Sinus rhythm requires ALL of the following 3 criteria:
- One P wave preceding each QRS complex
- All P waves should be uniform in shape
- Normal P wave axis is in the left lower quadrant (0-90 degrees), i.e. upright in both lead I and aVF (unless there is dextrocardia)
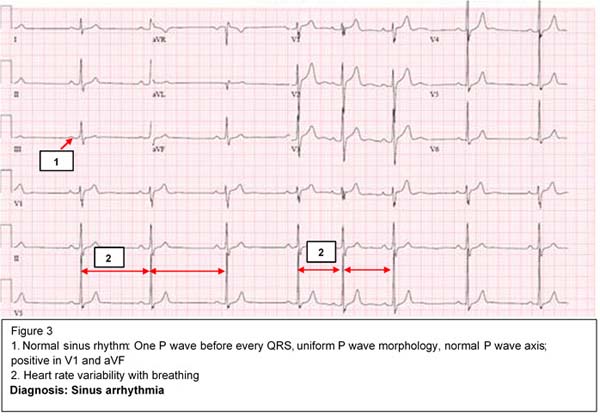
- The R-R interval in NSR does not have to be identical as it may change with breathing (sinus arrhythmia) (Figure 3.) The sinus arrhythmia is easier to appreciate with slower heart rates.
- HR increases during inspiration due to:
- Increased venous return
- Increased sympathetic tone
- HR decreases during expiration due to:
- Decreased venous return
- Increased parasympathetic tone
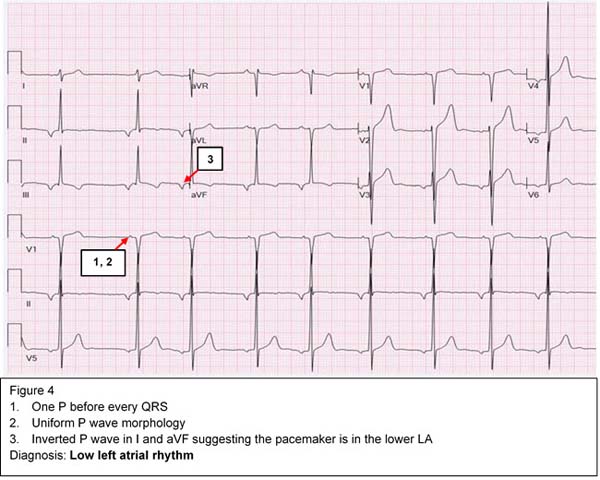
- Atrial rhythm (Figure 4)
- Characterized by narrow QRS complexes preceded by P waves that do not fulfill one or more of the normal sinus rhythm (NSR) criteria mentioned earlier.
- If the P wave morphology changes, this may indicate a multifocal origin which is called "wandering pacemaker".
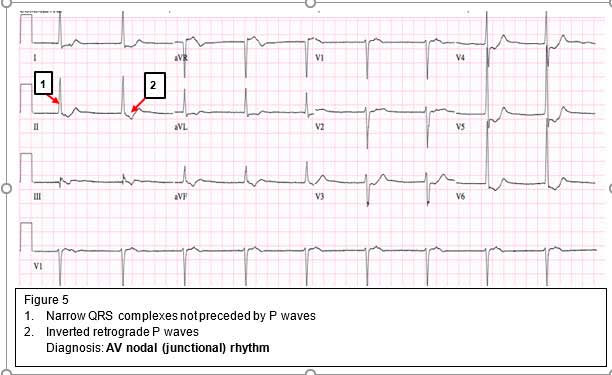
- AV nodal or junctional rhythm (Figure 5)
- Characterized by narrow QRS complexes that are not preceded by P waves.
- An inverted P wave may be seen following the QRS due to retrograde conduction.
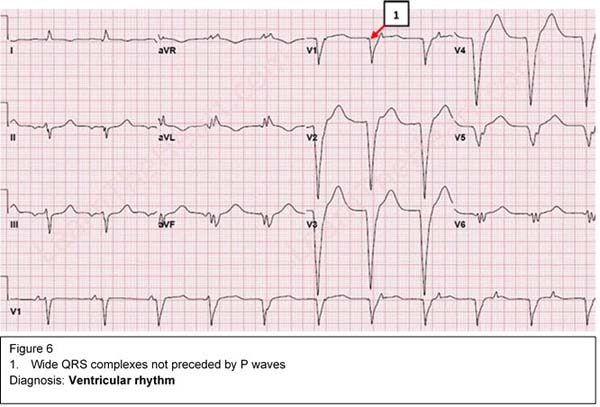
- Ventricular rhythm (Fgure 6)
- Characterized by wide QRS complexes that are not preceded by P waves.
If the sinus node fails to initiate the impulse, an atrial focus will take over as the pacemaker, which is usually slower than the NSR. When the atrial focus fails, the AV node will take over. Subsequently, if the AV node fails, the ventricular focus, which is the slowest, will take over as a pacemaker. Each time the focus is downgraded, the heart rate becomes slower based on the inherent automaticity of the pacemaker.
3. Axis: Determine both P wave and QRS axes. The net summation of positive and negative deflection is used to determine the axis. Look for two perpendicular leads (usually lead I and aVF) to determine in which quadrant the axis is located.
a) If QRS is positive in lead I and positive in aVF, the axis is in the left lower quadrant (0-90 degrees), which is normal
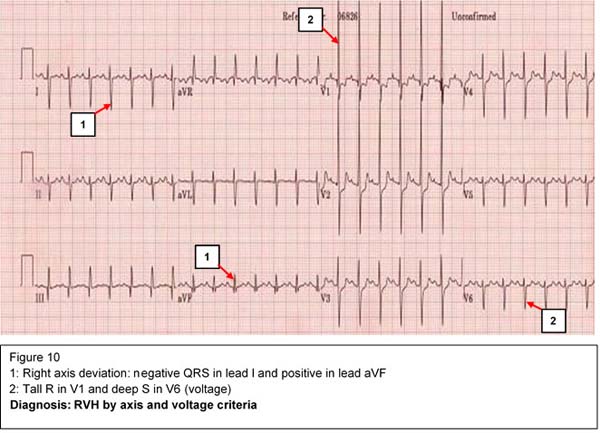
b) If QRS is negative in lead I and positive in aVF, the axis is in the right lower quadrant (90-180 degrees). This represents right axis deviation which can be normal in children.
c) If QRS is positive in lead I and negative in lead aVF, the axis is in the left upper quadrant (-90- 0). This represents left axis deviation.
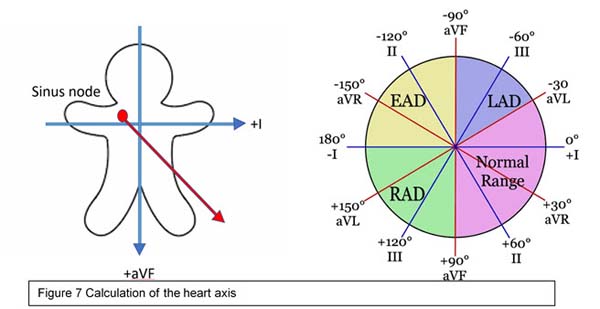
d. If QRS is negative in lead I and negative in lead aVF, the axis is called indeterminate. Precordial leads may determine if it is an extreme right or left axis deviation.
4. Durations/Intervals:
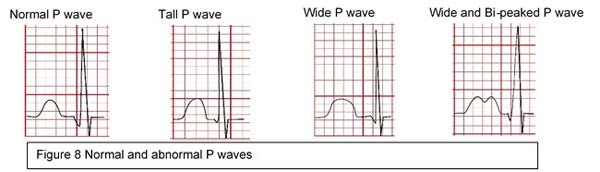
a) P wave: Represents atrial depolarization. Normally it is 2.5 mm wide and 2.5 mm high.
- Tall P waves = right atrial enlargement (RAE)
- Wide P waves = left atrial enlargement (LAE)
- Wide and tall or bi-peaked P waves = bi-atrial enlargement (BAE).
b) PR interval represents a delay in conduction in the AV node. It varies with age and heart rate and is usually <0.2 sec at any age.
c) QRS duration: Represents ventricular depolarization. Normally 2 small squares or 0.08 sec.
- Wide QRS may indicate:
- Ventricular contractions
- Bundle branch block
- Pre-excitation (Wolff-Parkinson White syndrome)
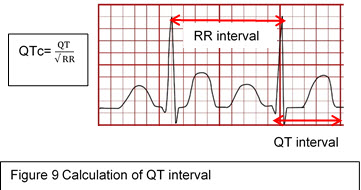
d) QT interval (measured from the beginning of Q to the end of T wave) represents both ventricular depolarization and repolarization
• QTc is the QT interval corrected for the heart rate. QTc=QT (in seconds)/square root of preceding RR interval (in seconds).
• See causes of long QT syndrome below.
5. Chamber Hypertrophy/Enlargement
a) Right ventricular hypertrophy (RVH):
- Voltage criteria (tall R in V1 and deep S in V6>95% for age) (see table below)
- Right axis deviation
- rSR' in V1 with a tall R' (> 10 mm)
- qR pattern in V1;
- Upright T wave in V1 > 1 week of age
- Newborns have upright T wave in V1
- T wave normally becomes inverted during the first week of life
- Upright T wave beyond the first week of life is a strong indicator of RVH
- T wave remains inverted in V1 throughout early childhood
- T wave becomes upright in V1 in late childhood and early adolescence and is no longer diagnostic of RVH
- ~75% of adults have upright T wave in V1
b) Left ventricular hypertrophy (LVH): Criteria are not as well defined as RVH
- Voltage criteria (tall R in V6 and deep S in V1);
- Left axis deviation;
- Strain pattern in left precordial leads (inverted T waves in V5 and V6)

6. Bundle Branch Block (delay in conduction in either the right or left bundle of His)
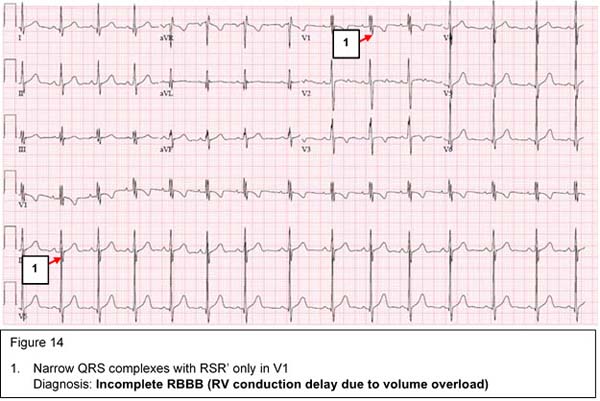
Incomplete right bundle branch block (iRBBB, RV conduction delay/ RV volume overload)
- Narrow QRS complexes
- RSR' only in V1
- Does not qualify for RVH criteria
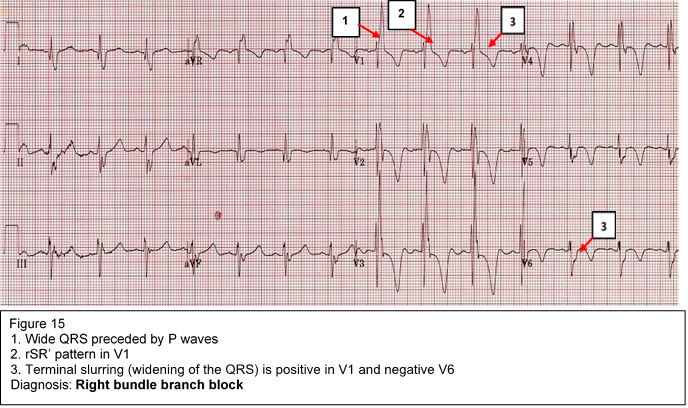
Complete right bundle branch block
- Wide QRS complexes in all leads preceded by P waves
- rSR' in V1
- Terminal slurring (widening of QRS) is positive in V1 and negative in V6
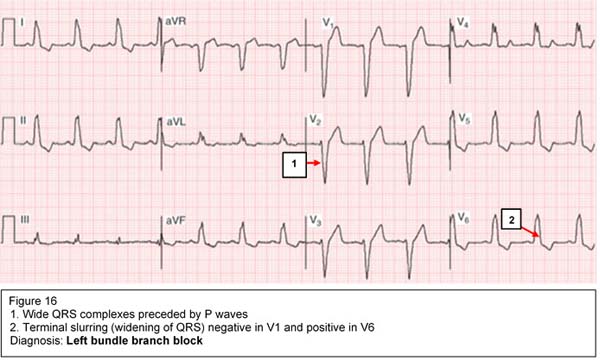
Complete left bundle branch block
- Wide QRS complexes in all leads preceded by P waves
- rSR' only in V6
- Terminal slurring (widening of QRS) is positive in V6 and negative in V1